Friday November 17, 2017
Site Usage Report
Thought might be worth giving regular visitors a heads-up on how the website is being used.
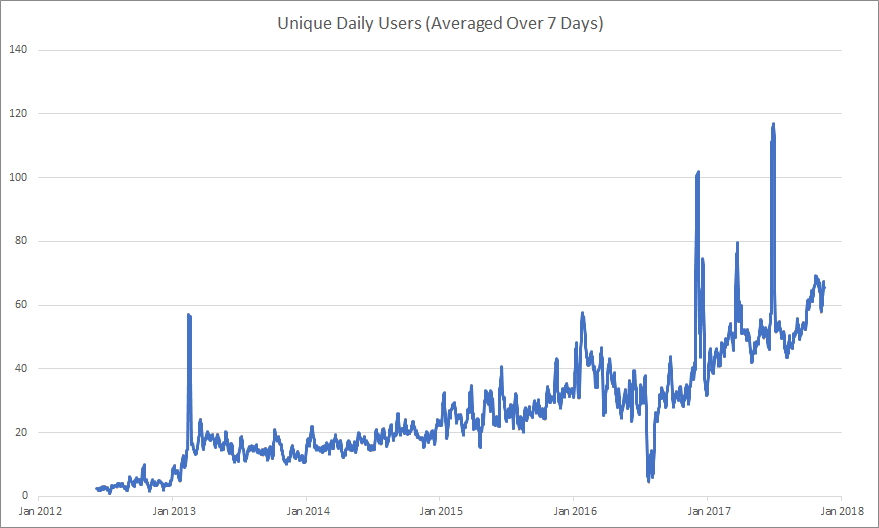
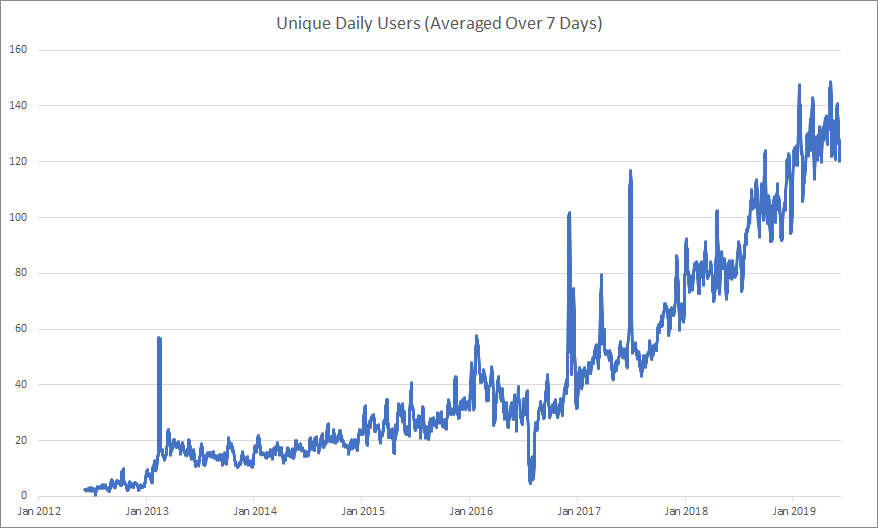
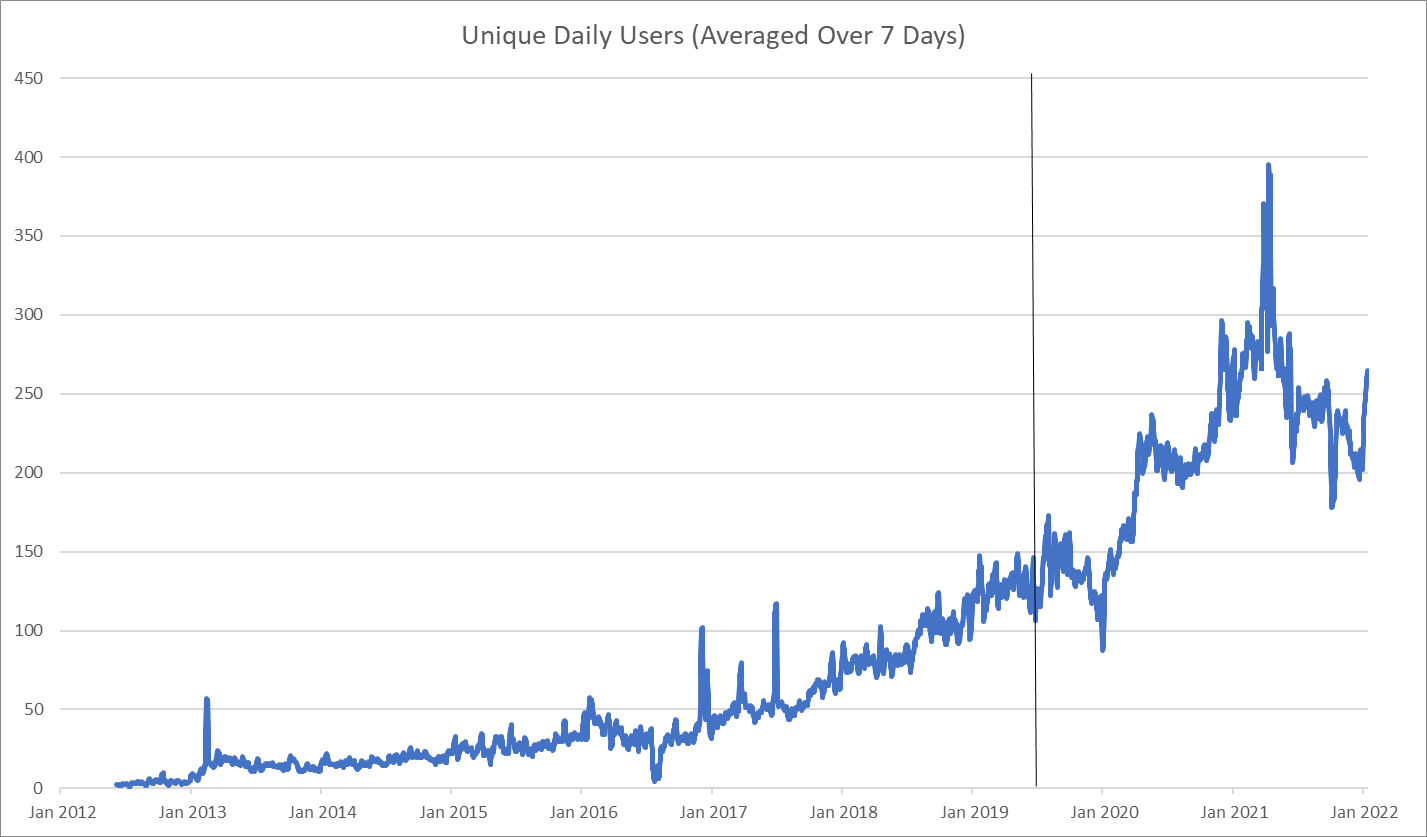
The first graph shows the average daily number of different visitors we have. The spikes are caused by certain occasions when somebody might share a page on Facebook, so you get a sudden rush of new visits. The dip in 2016 was when the web-host was essentially unavilable for a few weeks.
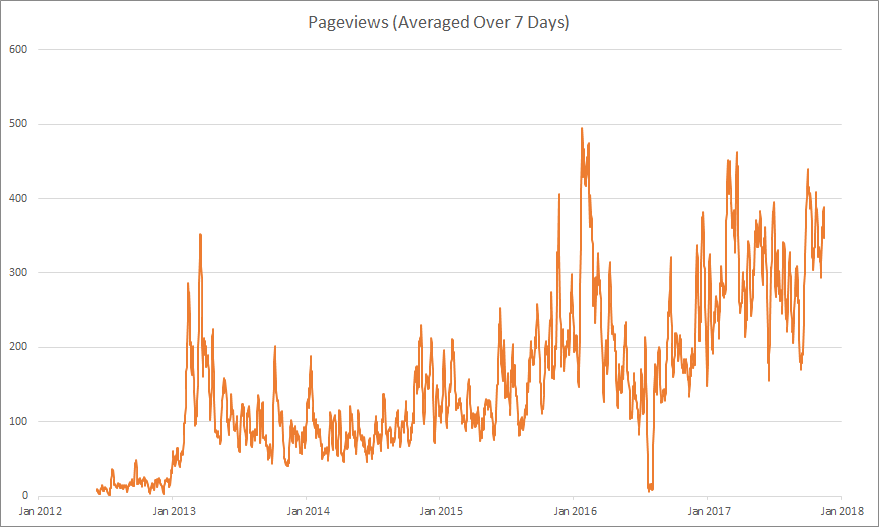
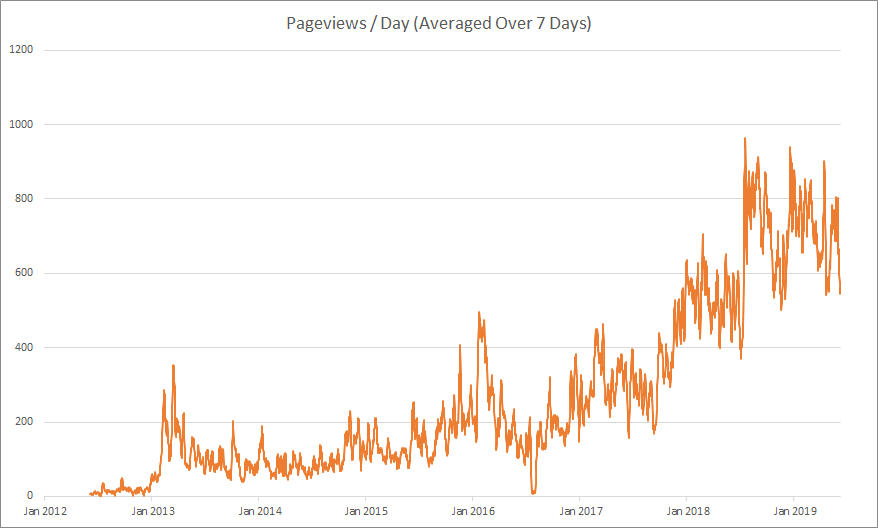
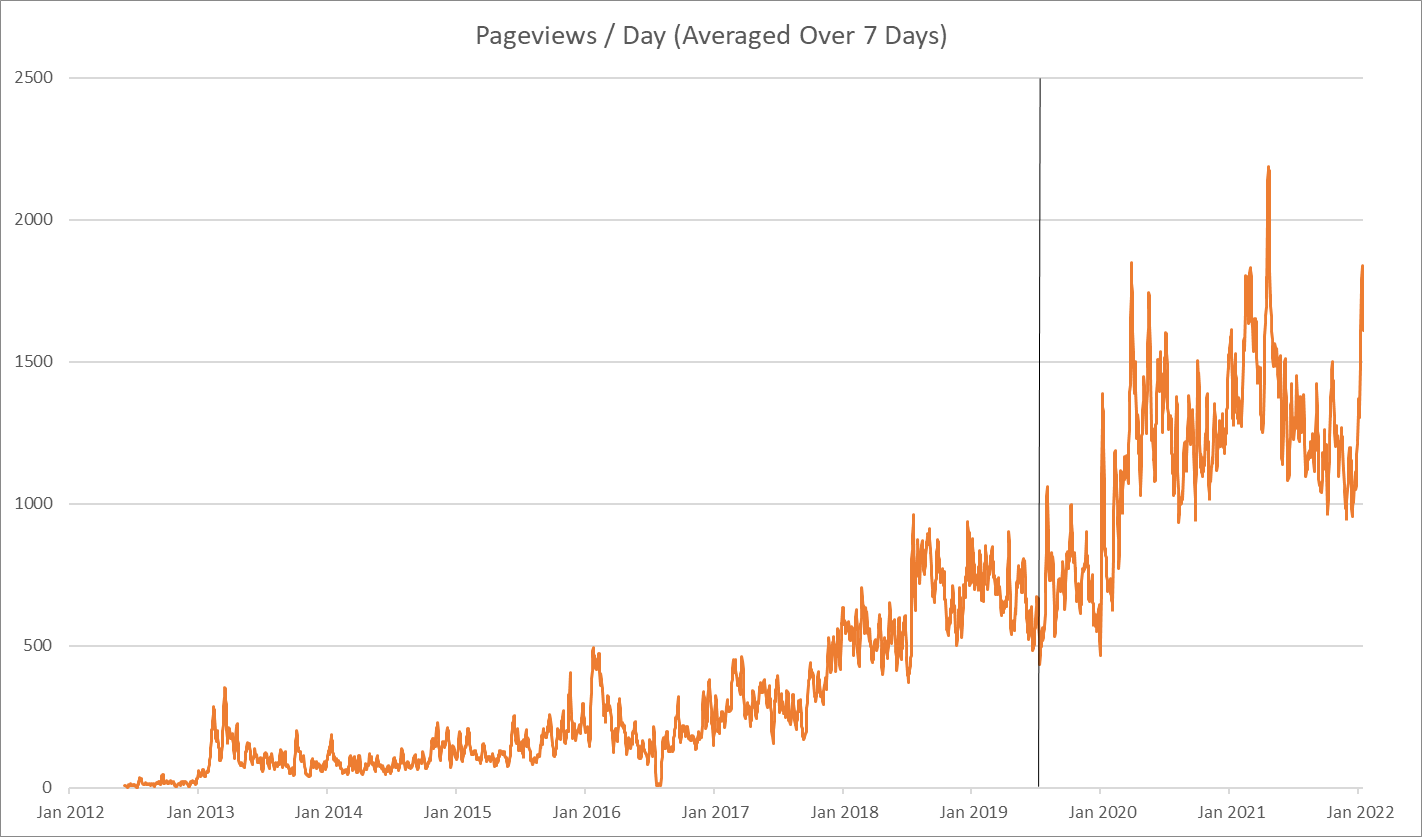
The second graph of unique daily page views shows the same pattern. It is slighly less useful as although usually my own visits in working on the site are excluded, for certain periods that hasn't been the case, so that has made the data slightly less reliable.
So at the moment we get about 50 different visitors each day, that includeds the regulars and those just on one off Google searches, and if content is being added, can be 500+ page views. So seems there is still a good interest in this material and Brethren History research in general. Hope that encourages everyone who has contributed via adding info, or commetns etc, that it is all being read!
